How it works
Product
-
Build your first AppGet started with Inistate in six easy steps
-
PlatformOn the cloud, in office, work from home, or on the move
-
FormLearn why our forms is so important for growing business
-
FlowThe easiest way to build a powerful process with our flows
-
FeaturesComprehensive tools for workflow automation, task management, and team collaboration
-
BuilderDesign, develop, and preview your dream app effortlessly in one interface
-
DashboardYour business insights at a glance
-
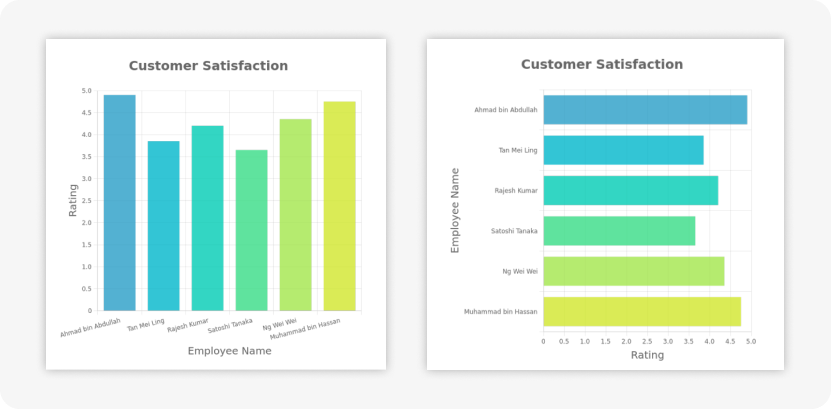
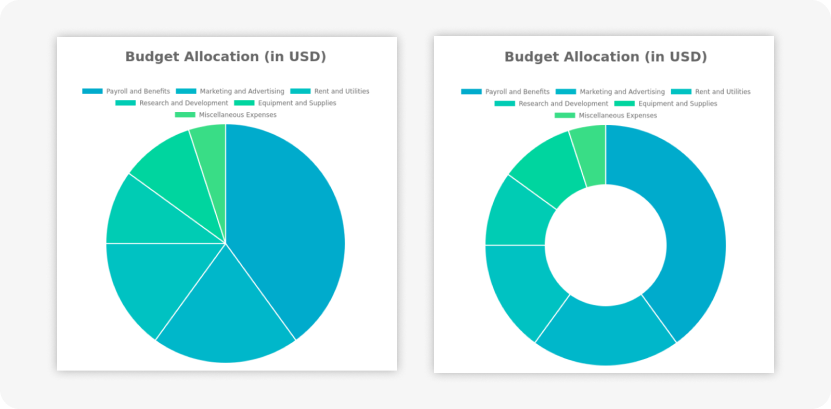
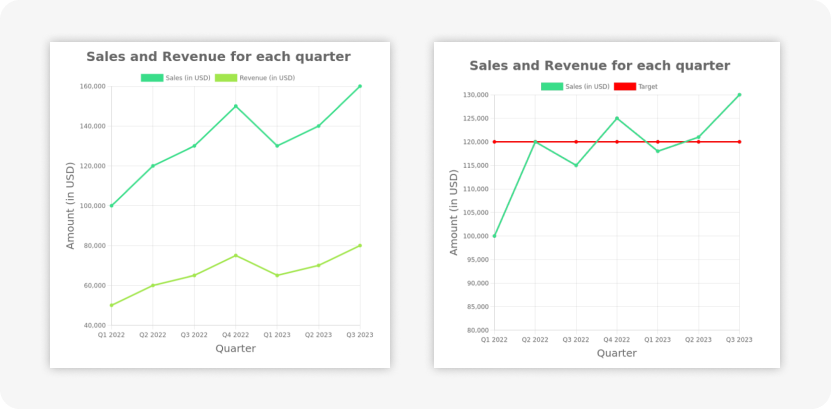
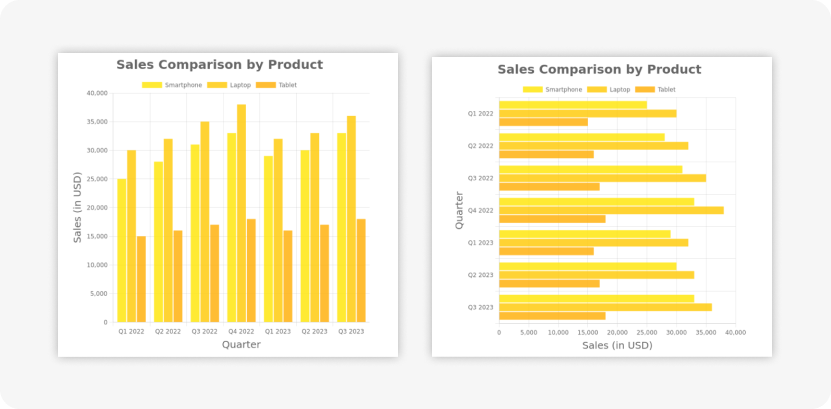
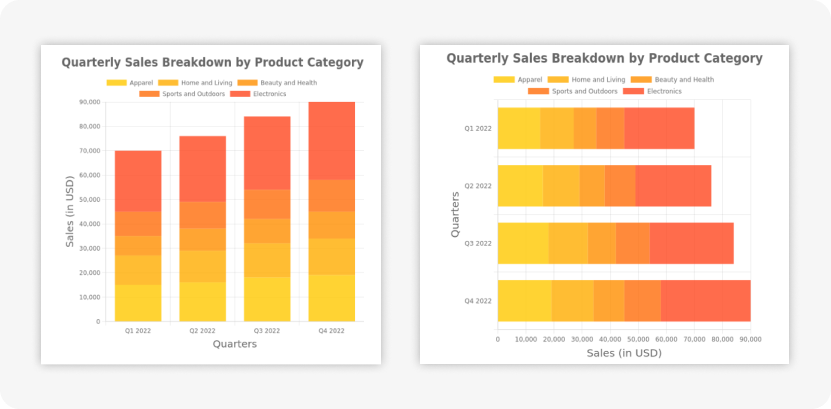
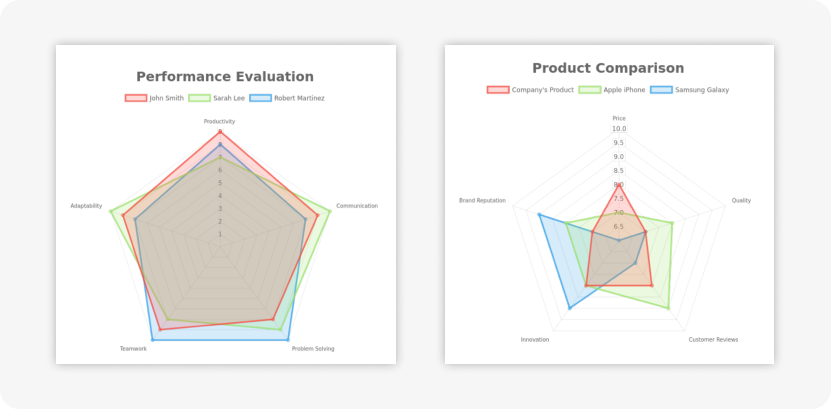
ChartsUnlock the capabilites within your data
Solution
Pricing
-
Discover what Inistate can offer youLet Inistate AI guide you to solutions that elevate your productivity.
-
All Industryready solutions for all businesses
-
Agriculturesustainable, efficient crop and livestock management
-
Educationinteractive, personalized learning experiences for students
-
Health Careenhancing treatments and patient outcomes
-
Information Technology (IT)transforms communication, data management, powering industries worldwide
-
Manufacturinginnovates, producing essential goods, driving economic growth globally
-
Retailoffers products, fuels commerce, shaping consumer experiences and economies
-
Transportationenabling movement and trade, driving global economic interactions
-
Otherother ready solutions
Learn
-
Video tutorialsStep by step guidance for configuration
-
CommunityShare, learn and grow together
-
Knowledge BaseArticles and Tutorials
-
DocumentationExplore resources to navigate and use Inistate effectively
-
SupportHelp and support
-
Contact UsHave question? Just let us know
-
Trust CenterTrust and security
-
Partners and ConsultantsFind Expertise for Collaborative Partnerships
-
StatusService status
Log In


