Use cases
-
Client document collectionSend the request once. Inistate collects the document, files it, chases what's missing, and routes for review.
-
IT service ticketsA client pings on Slack. Inistate logs the ticket, routes it, follows up, and closes it under SLA.
-
Field service jobsQuote to paid. Your technician snaps a photo on site — Inistate captures parts, time, and the invoice writes itself.
-
Property maintenanceSnap a photo of a maintenance issue. Inistate logs the job, assigns the vendor, follows up, and tracks it to done.
-
Browse all industriesSee ready solutions across logistics, healthcare, manufacturing, retail, and more.
Why Inistate
-
The HarnessThe category Inistate defined for governed human-AI collaboration
-
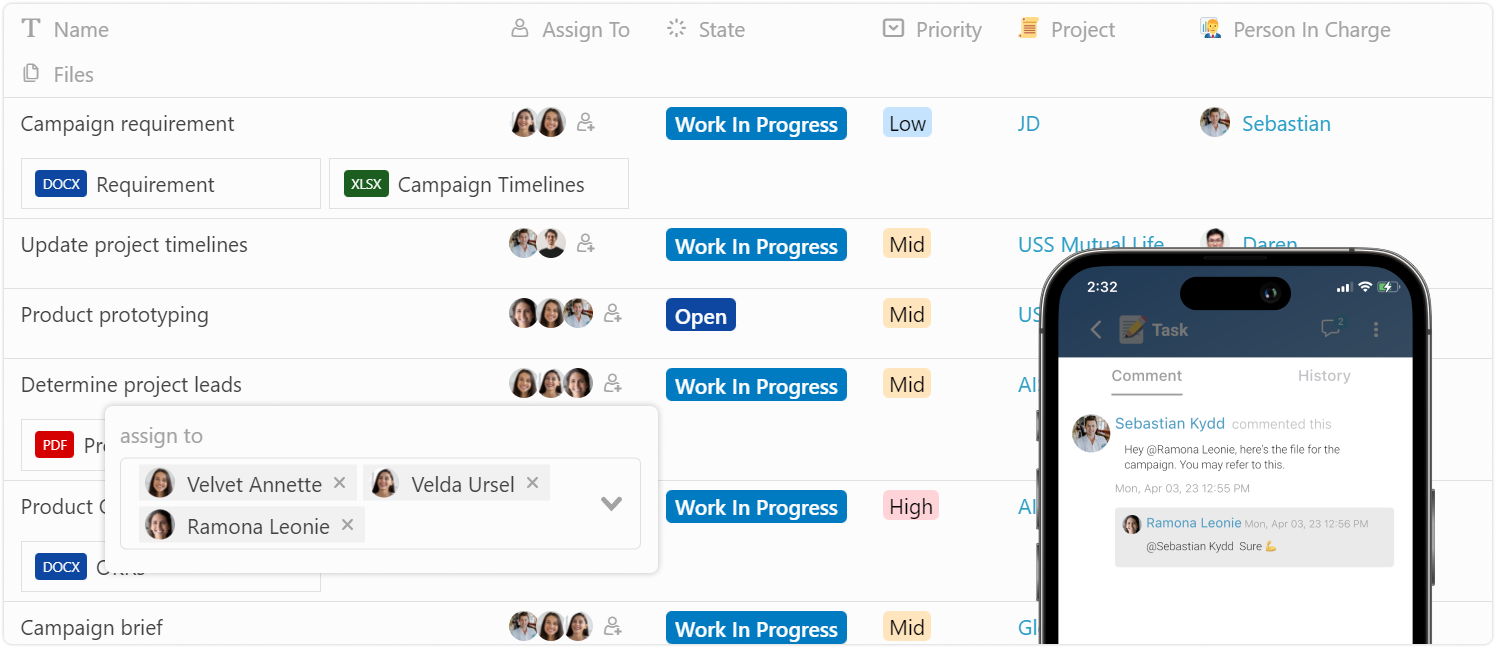
The ProofWatch real-world inputs become tracked work — photo to workflow, message to job, spreadsheet to process
-
Actor ParityFor developers and architects — humans, AI, and hybrid actors as peers on the same primitive
-
Operational ReasoningFor developers and architects — the schema is the new prompt
-
Three-Clock TheoryFor analysts and investors — models are rented, the harness is owned
Product
Solution
Pricing
-
Health CareAudit-grade records with HIPAA-ready fields shipped natively
-
AgricultureField operations, offline-first, signed by the actor — human or AI
-
EducationStudent records and approvals on one audited primitive
-
Information Technology (IT)Ticket lifecycle and MCP-native AI handling on the same form
-
ManufacturingWork orders, multi-actor execution, one audit trail across the shift
-
RetailInventory and store ops with one operational source of truth across locations
-
TransportationDispatch, field jobs, and proof-of-delivery on a governed state machine
-
OtherSame primitive. Whatever you run.
Learn
-
Video tutorialsStep by step guidance for configuration
-
CommunityShare, learn and grow together
-
Knowledge BaseArticles and Tutorials
-
DocumentationExplore resources to navigate and use Inistate effectively
-
SupportHelp and support
-
Contact UsHave question? Just let us know
-
Trust CenterTrust and security
-
Partners and ConsultantsFind Expertise for Collaborative Partnerships
-
StatusService status
Log In